CRO Report
Understand how CRO Report turns behavioral data into an expert-level store audit with prioritized, actionable recommendations.
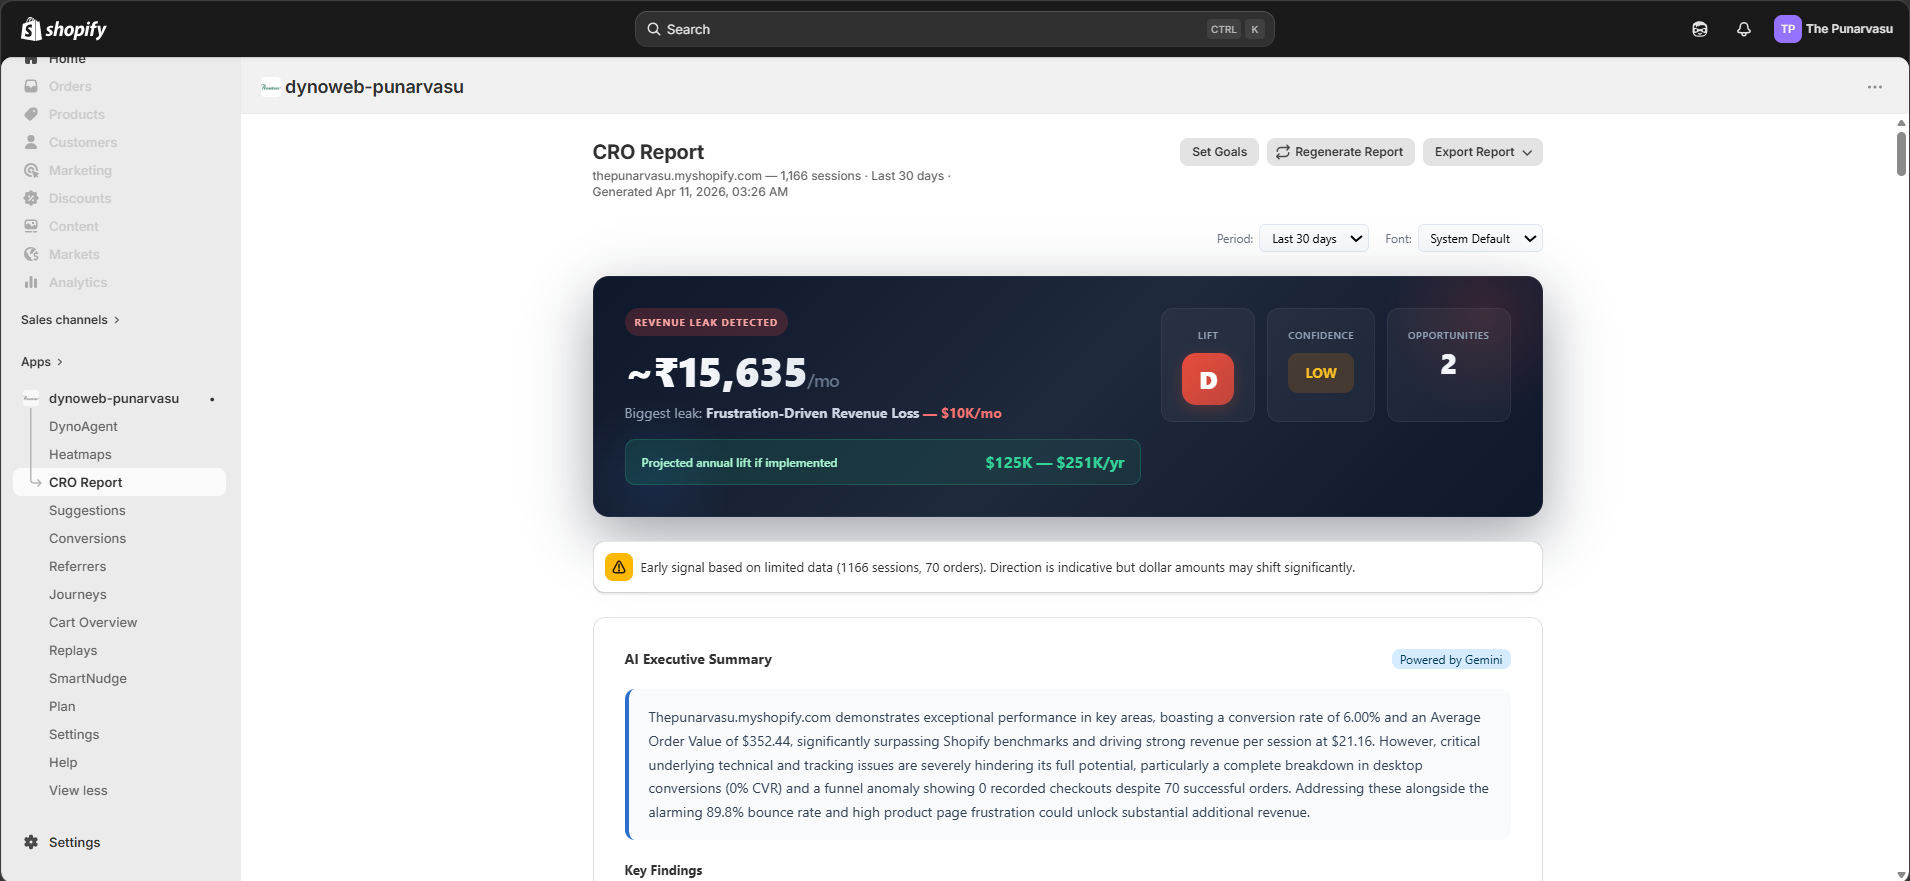
CRO Report is where DynoWeb converts raw visitor behavior into a structured optimization analysis. It generates a comprehensive conversion rate optimization report — the kind normally produced by a CRO agency — using the behavioral signals DynoWeb has already collected, without requiring any manual data gathering or spreadsheet work.
What It Does
CRO Report has two connected parts.
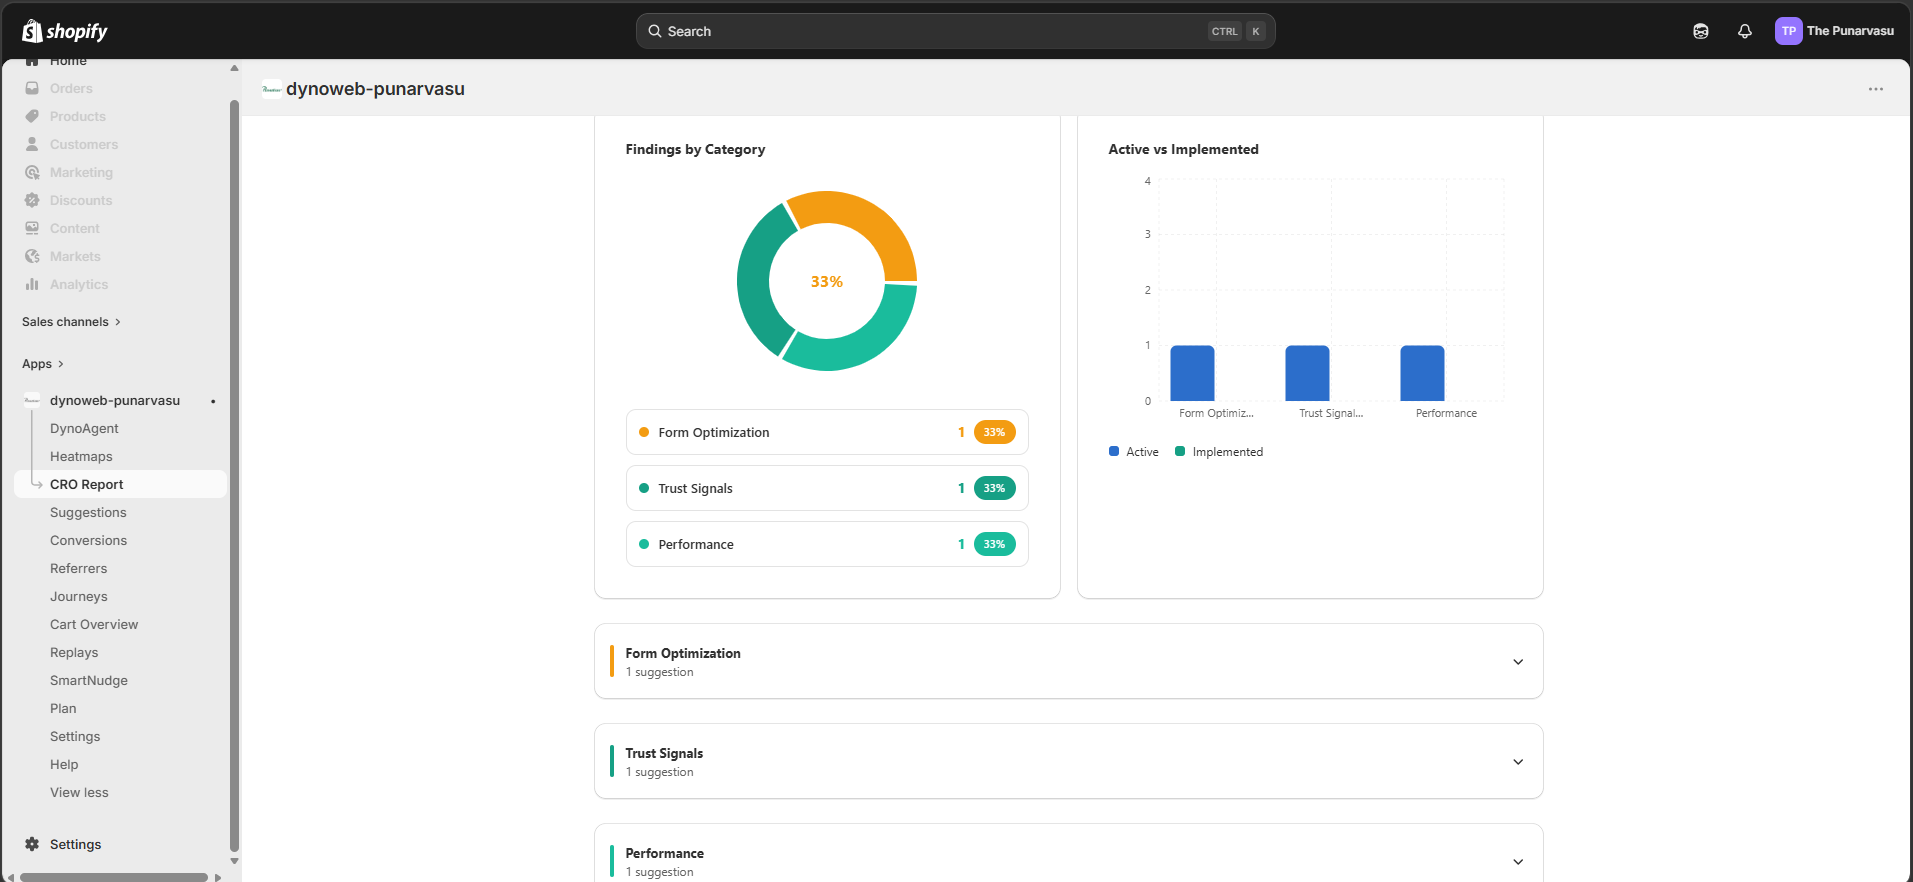
The report itself is a multi-section analysis covering every dimension of store performance — KPIs, conversion funnel, device breakdown, frustration signals, traffic sources, scroll depth, and more. Each section surfaces data alongside context so the numbers tell a story, not just fill a table.
The suggestion engine sits inside the report and produces specific, evidence-backed recommendations grouped into ten categories including CTA optimization, mobile experience, trust signals, and cart & checkout. Every suggestion comes with an implementation guide — file paths, code snippets, and step-by-step theme editor instructions — so the fix can be handed directly to a developer or applied by the merchant.
Once a report is generated, it can be exported as a PDF, shared via a public link, or reviewed directly in the dashboard. Suggestions can be marked as implemented, dismissed, or rated for helpfulness.
Setting Goals First
Before generating a report, the Goals step asks the merchant to set two or three KPI targets — conversion rate, average order value, revenue per session, or any of the thirteen tracked metrics. These targets anchor the report: every section shows progress toward the goals, and the suggestion engine prioritizes fixes that move the needle on the metrics that matter most.
Default targets are available for merchants who want to skip configuration and get straight to the analysis.
Report Sections
The report is organized into sections that flow from high-level health down to granular page-by-page detail:
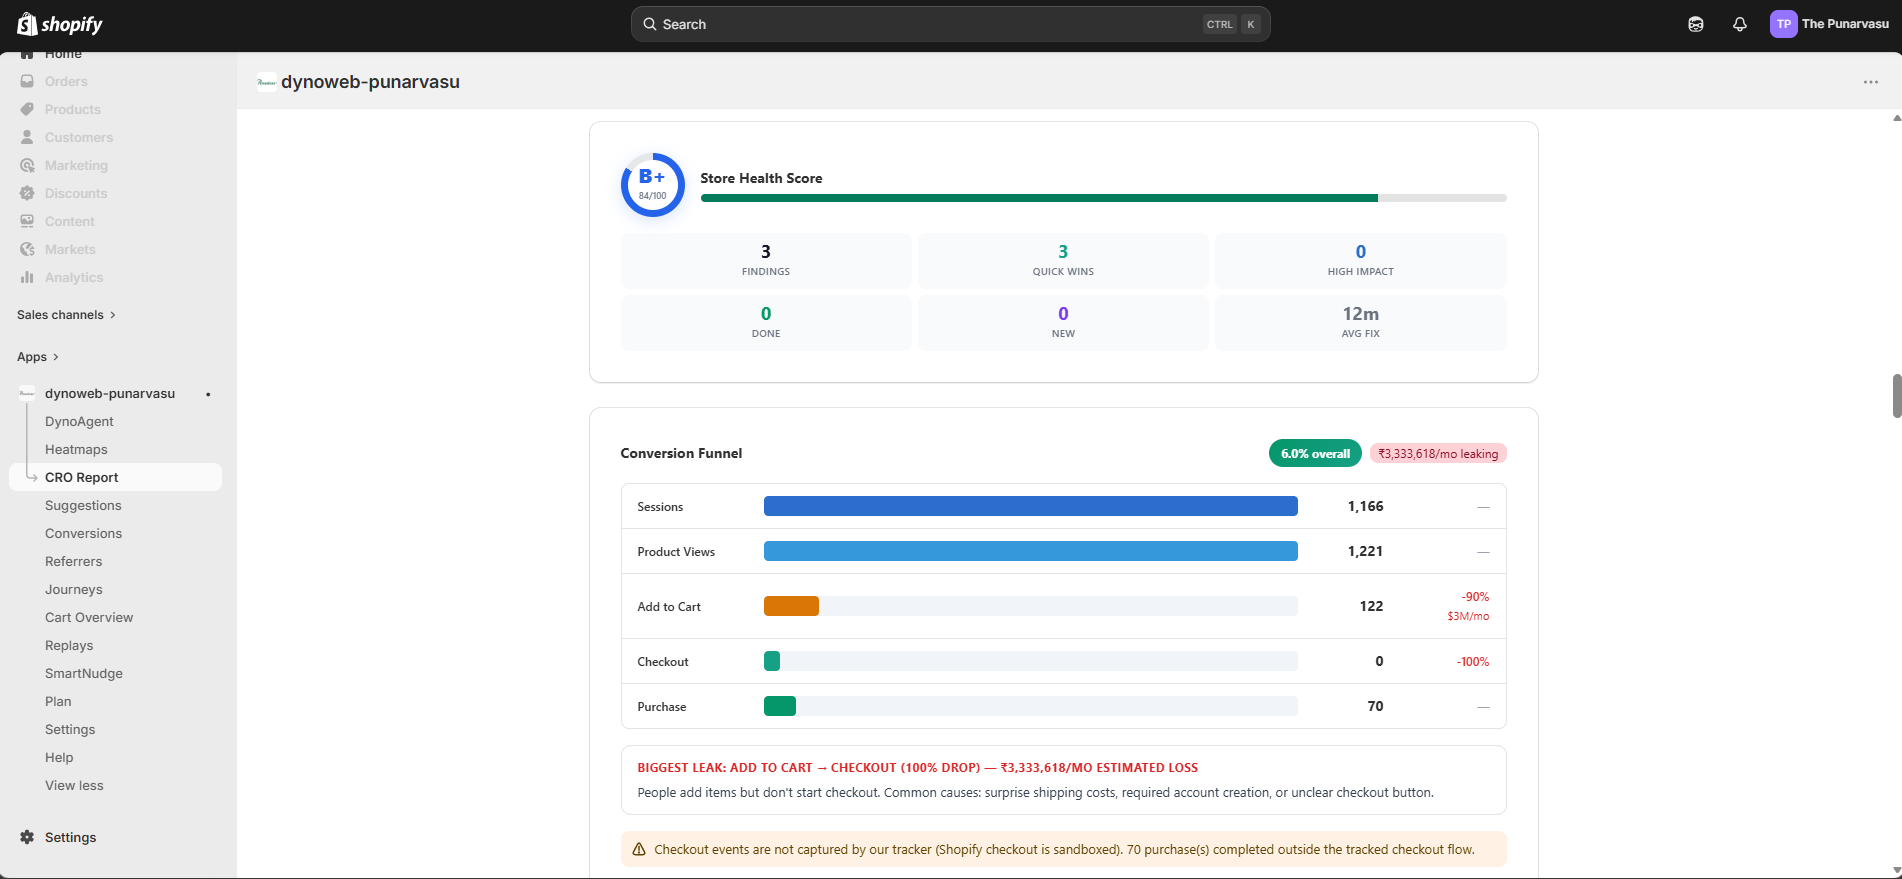
Quick Wins — the three easiest fixes with the highest expected return, pulled from the full suggestion list and sorted by ease plus impact.
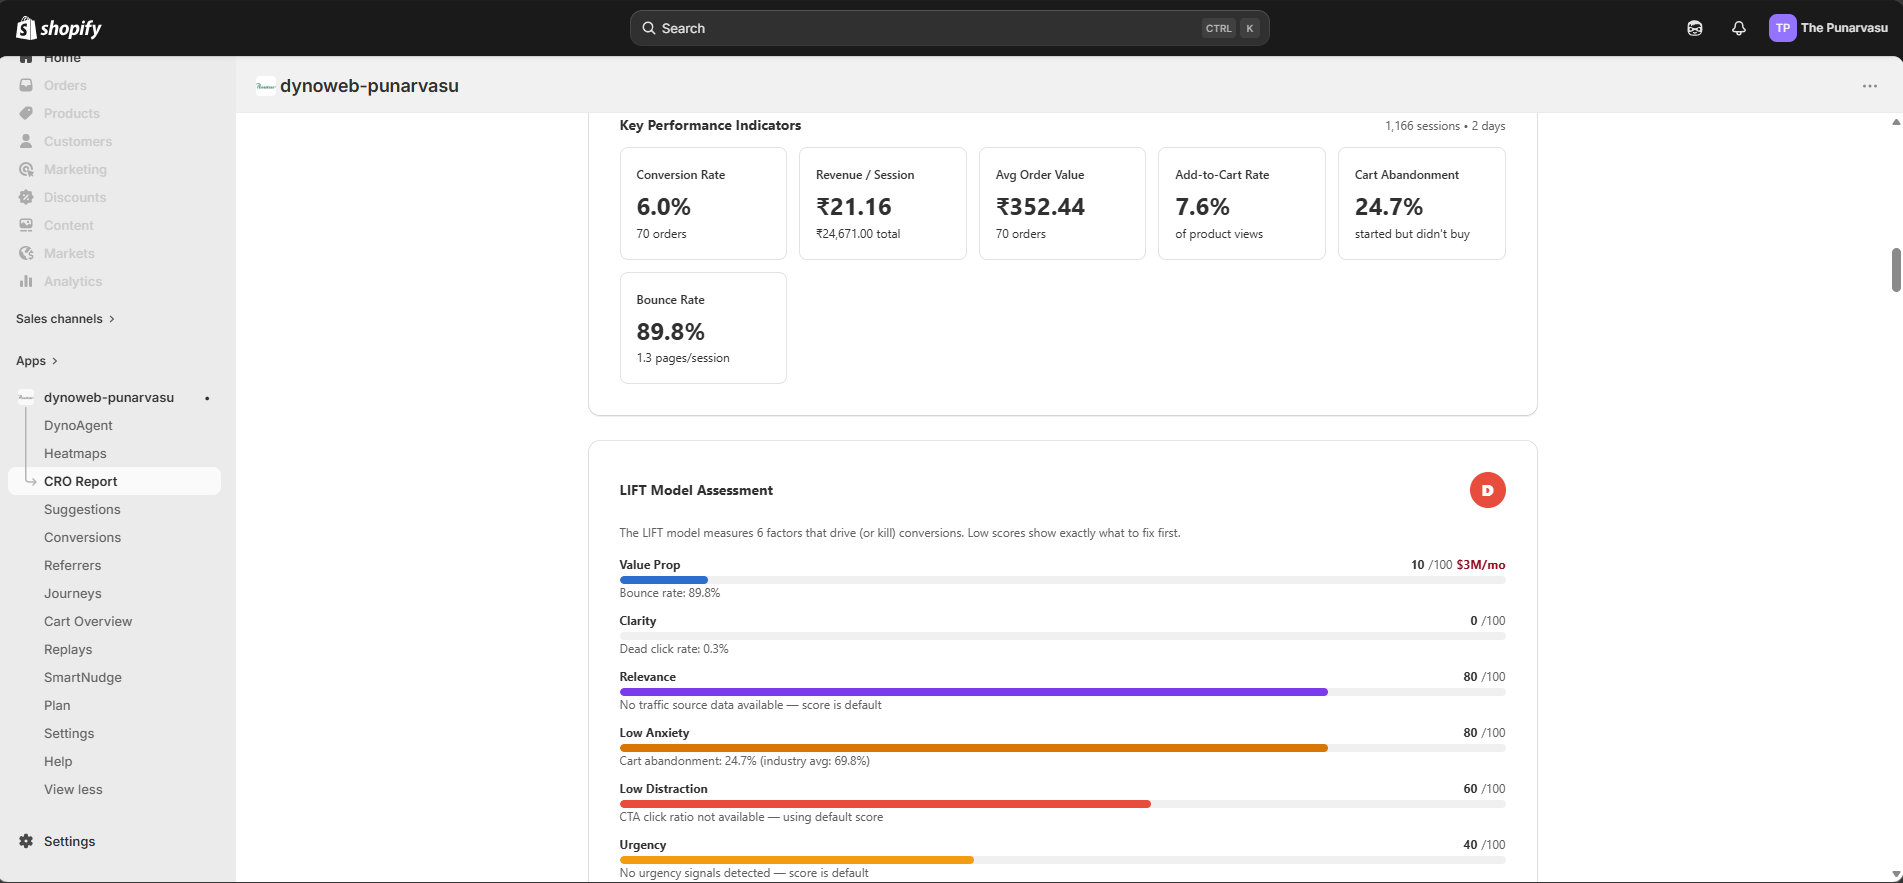
KPI Cards — six cards showing conversion rate, revenue per session, average order value, add-to-cart rate, cart abandonment rate, and bounce rate. Each card includes the current value, the trend compared to the previous period, and a benchmark grade.
AI Executive Summary — a narrative paragraph generated by AI that interprets the data, calls out key findings, and lists priority actions ranked P1 through P3. Available on Pro plans.
LIFT Model & Revenue Impact — six conversion factors (value proposition, clarity, relevance, anxiety, distraction, urgency) each scored zero to one hundred, plus a weighted overall score. Beside it, the revenue impact calculator estimates how much revenue is being left on the table across six leak types: mobile conversion gap, scroll depth loss, frustration-driven loss, cart abandonment recovery, dead click loss, and traffic source relevance gap.
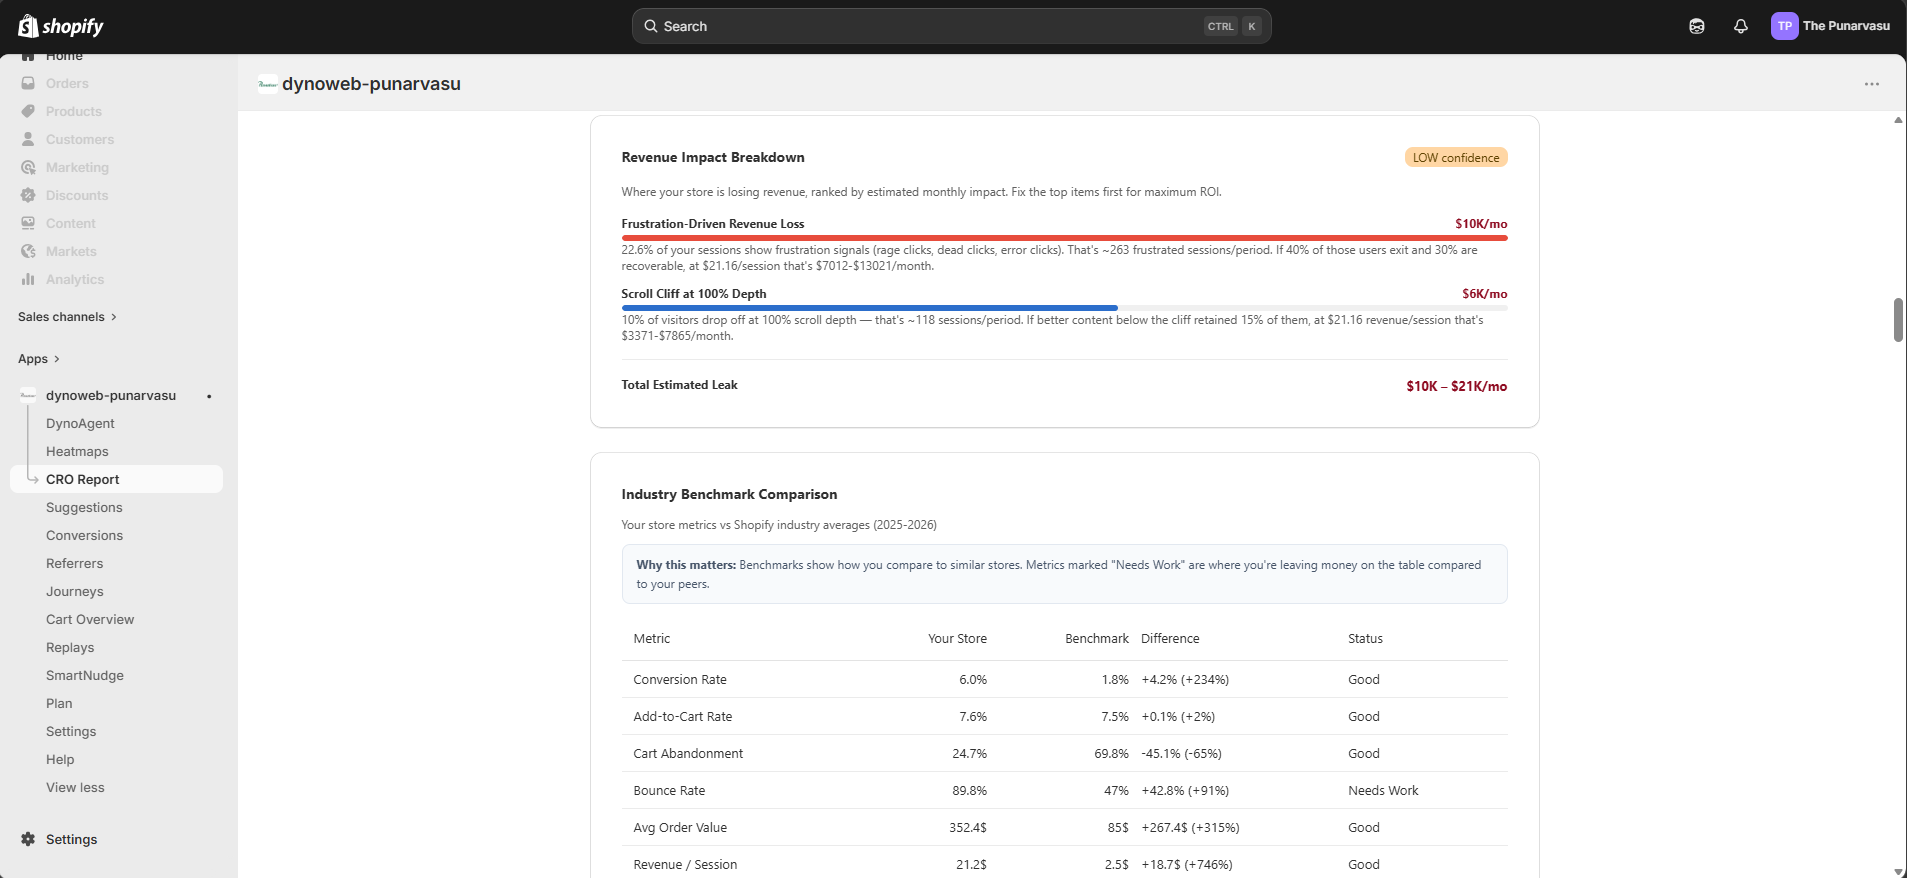
Industry Benchmarks — a comparison table showing the store's metrics against Shopify industry averages, graded as excellent, good, average, or poor.
Conversion Funnel — a five-stage visualization from sessions through product views, add to cart, checkout, and purchase. Each stage shows the absolute count and the drop-off rate to the next stage, with revenue leak attribution at the biggest drop-off points.
Traffic Source Intelligence — a breakdown by channel (direct, organic search, paid search, social, email, referral) showing sessions, conversion rate, bounce rate, and revenue per source.
Device Breakdown — desktop, mobile, and tablet compared side by side with session share, orders, revenue, conversion rate, and average scroll depth.
Scroll Depth Analysis — how far visitors scroll at the twenty-five, fifty, seventy-five, and one hundred percent marks, with drop-off rates between each depth.
Frustration Signals — rage clicks, dead clicks, error clicks, and mouse shakes aggregated across the store, with the top frustrating elements and pages listed by frustration index.
Journey Analysis — the most common paths to purchase, the pages where visitors drop off, entry page effectiveness, and loop detection where visitors bounce back and forth. Available on Pro plans.
Heatmap Intelligence — behavioral patterns detected across the store including phantom clicks, dead zones, click scatter, scroll cliffs, and CTA underperformance. Available on Pro plans.
Page-by-Page Analysis — a detailed table of every tracked page with sessions, conversion rate, engagement metrics, and the number of suggestions attached to it.
Categorized Suggestions — the full suggestion list grouped into ten categories, each with a title, description, expected impact, difficulty level, estimated implementation time, and a complete implementation guide.
How To Use It Best
The best starting point is to set goals that reflect the store's current priorities — if cart abandonment is the known problem, set a target for cart abandonment rate and let the report engine focus there.
Generate a report after at least seven days of tracking data. The data readiness card at the top of the report shows whether there are enough sessions and pages to produce reliable analysis. Reports generated with fewer than fifty sessions will carry an insufficient confidence label.
Start with the Quick Wins section. These are the fixes that combine the highest impact with the lowest effort. Work through them before moving to the deeper sections.
For suggestions that require a developer, use the export button to generate a PDF with full implementation guides. For suggestions that can be handled in the theme editor, follow the numbered steps in each suggestion's guide directly.
After implementing a batch of suggestions, generate a new report in the next period to measure the effect. The goal progress section will show whether the changes moved the tracked KPIs toward their targets.
Sharing and Exporting
Reports can be exported as a formatted PDF with customizable fonts — System Default, Georgia, Inter, or Merriweather — for client or team handoff. A shareable public link can also be generated, giving read-only access to the full report for seven days without requiring a DynoWeb login.

CRO Report turns the behavioral data DynoWeb collects into a structured, evidence-backed optimization plan, giving merchants the same depth of analysis a CRO agency would deliver — generated in minutes instead of weeks.
Previous
Suggestions
Understand how Suggestions turns theme checks and visitor behavior into prioritized, fix-it-yourself recommendations.
Next
SEO Autopilot
SEO Autopilot finds SEO gaps across your whole store and fixes them with AI-written content, applied in one click through Shopify's Admin API — fully reversible.