Referrers
Understand how Referrers reveals where your visitors come from, which traffic sources drive conversions and revenue, and whether AI shopping engines like ChatGPT, Perplexity, and Google AI Mode can actually find and recommend your store.
Referrers is where DynoWeb turns raw traffic data into a clear picture of acquisition performance — both today's traffic and tomorrow's. It shows which channels, domains, and marketing campaigns are sending visitors to the store, which of those visitors are converting and generating revenue, and now also surfaces the technical blockers that prevent AI shopping agents from recommending the store in the first place.
What It Does
Referrers has three connected parts.
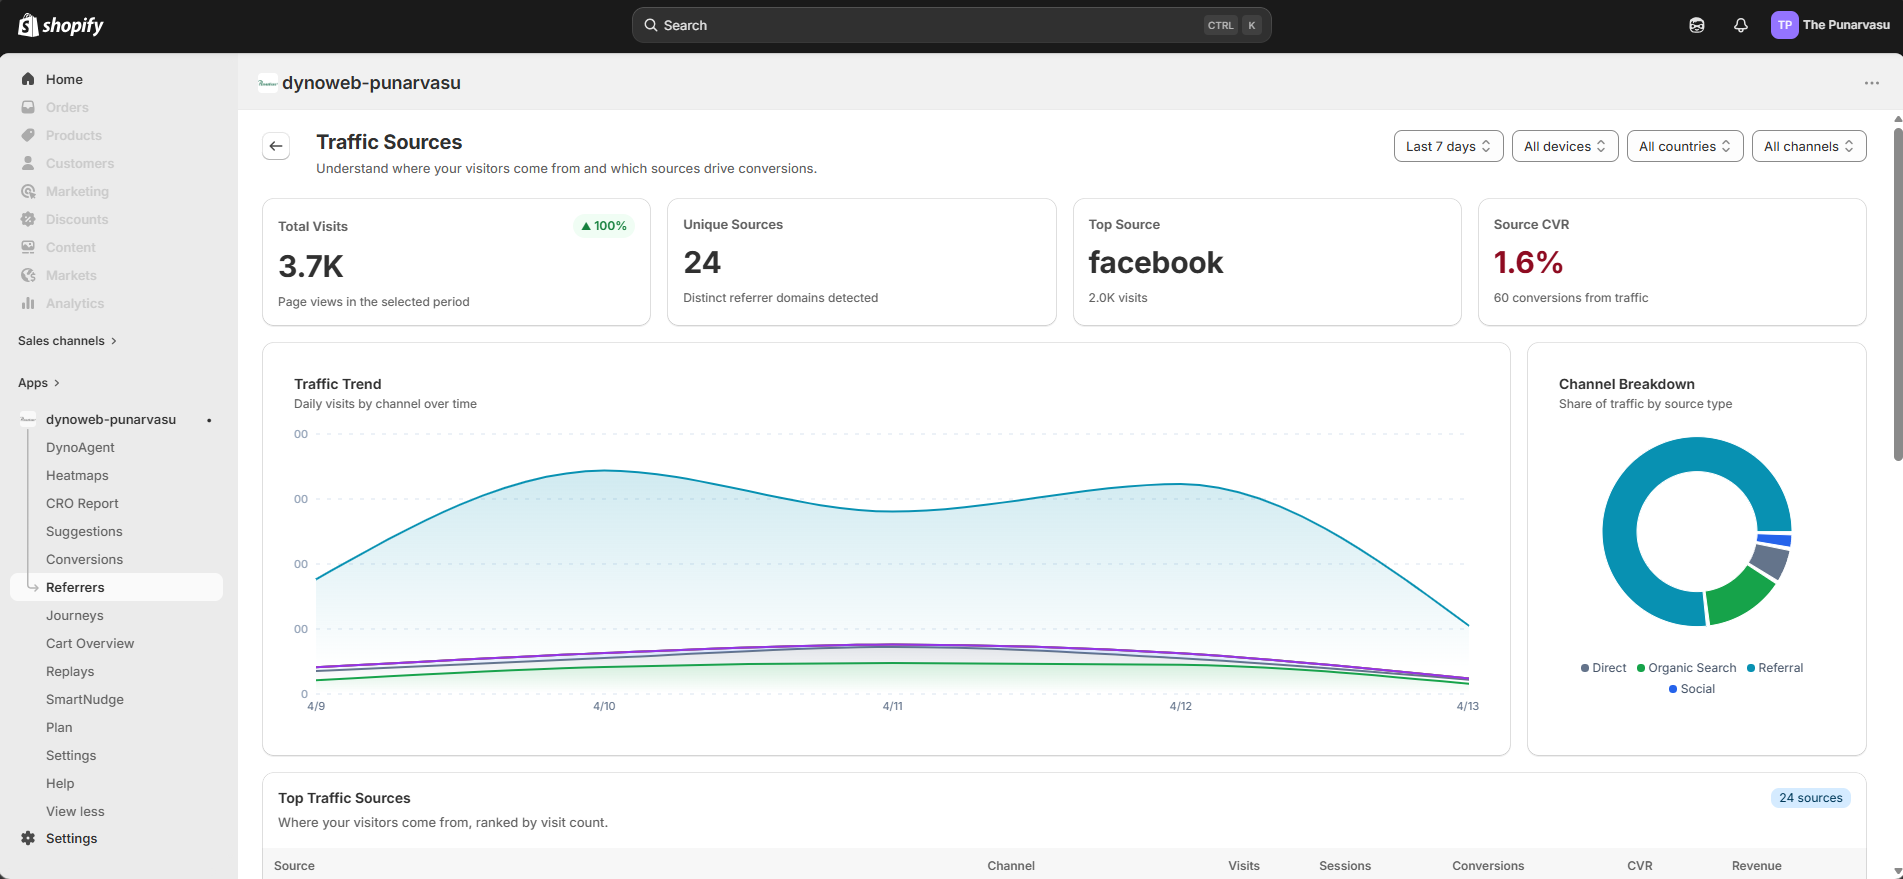
The traffic dashboard shows an at-a-glance view of where visitors are coming from, how traffic volume is trending over time, and which channels dominate the mix. Four KPI cards, a daily trend chart, and a channel breakdown donut chart give an immediate read on acquisition health.
The source tables below the charts go deeper, listing every referrer domain and UTM campaign with visits, sessions, conversions, conversion rate, and attributed revenue. This is where a merchant finds out whether that Instagram campaign is actually driving purchases or just sending window shoppers.
The AI Search readiness card sits below the tables. It runs a deterministic audit against the storefront and Shopify admin to detect things that block ChatGPT, Perplexity, Google AI Mode, Claude, and other AI shopping engines from recommending products. Findings are surfaced inline with deep-links straight to where the merchant fixes them in Shopify — most are five to ten minutes of work each.
Every visit is automatically classified into one of six channels — direct, organic search, paid search, social, email, or referral — using a priority-based system that checks UTM parameters first, then matches the referrer domain against a library of known search engines, social networks, and email providers.
The Dashboard
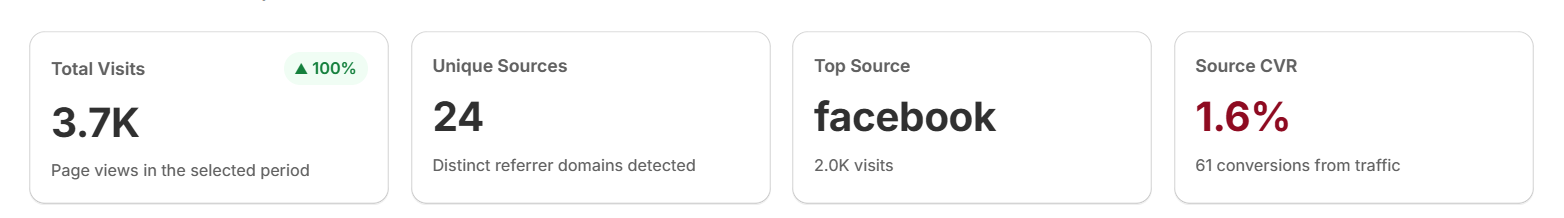
KPI Cards — four cards across the top of the page:
- Total Visits — page views in the selected period, with a percentage trend compared to the previous equal-length period.
- Unique Sources — how many distinct referrer domains sent traffic.
- Top Source — the single domain that drove the most visits, with its count.
- Source CVR — the overall conversion rate across all traffic sources.
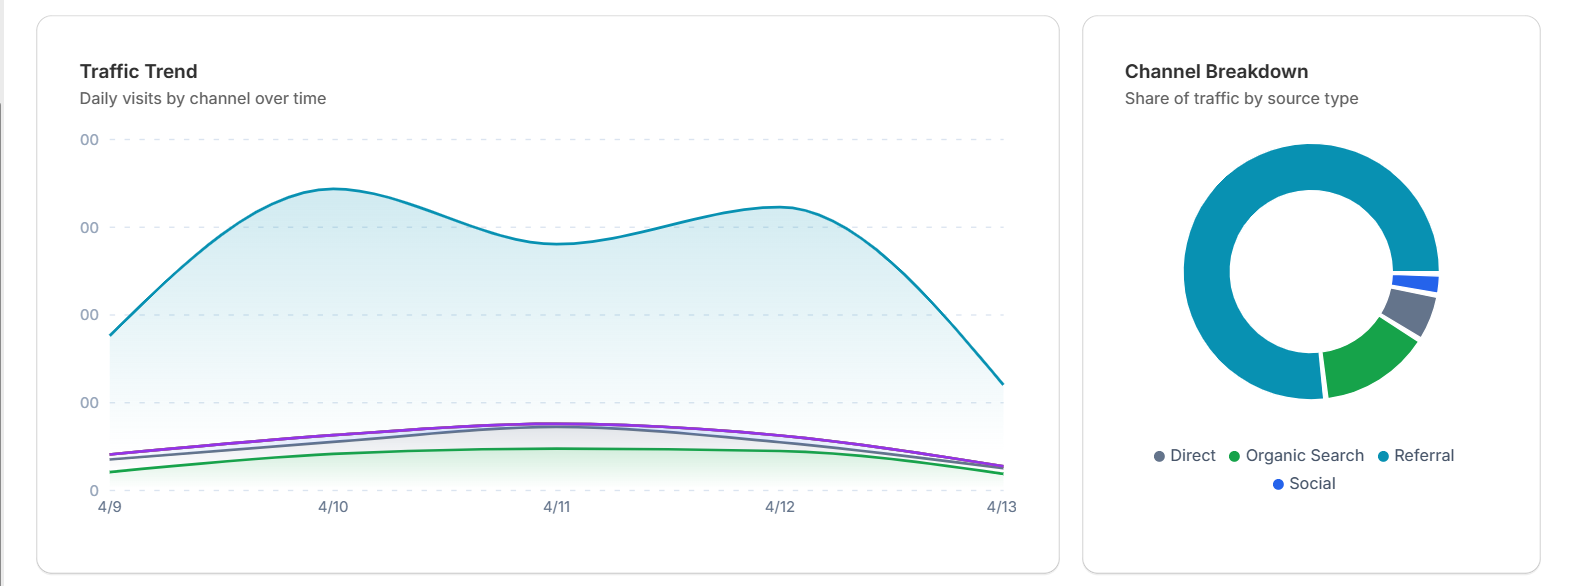
Traffic Trend Chart — a stacked area chart showing daily visit volume broken down by the six traffic channels over the selected date range. Each channel is color-coded (direct in slate, organic search in green, paid search in amber, social in blue, email in purple, referral in cyan) with gradient fills. Hovering over any day shows a tooltip with the exact count per channel.
Channel Breakdown — a donut chart beside the trend chart showing the proportion of total visits per channel. The legend lists each channel with its color, and the tooltip shows the visit count and percentage.
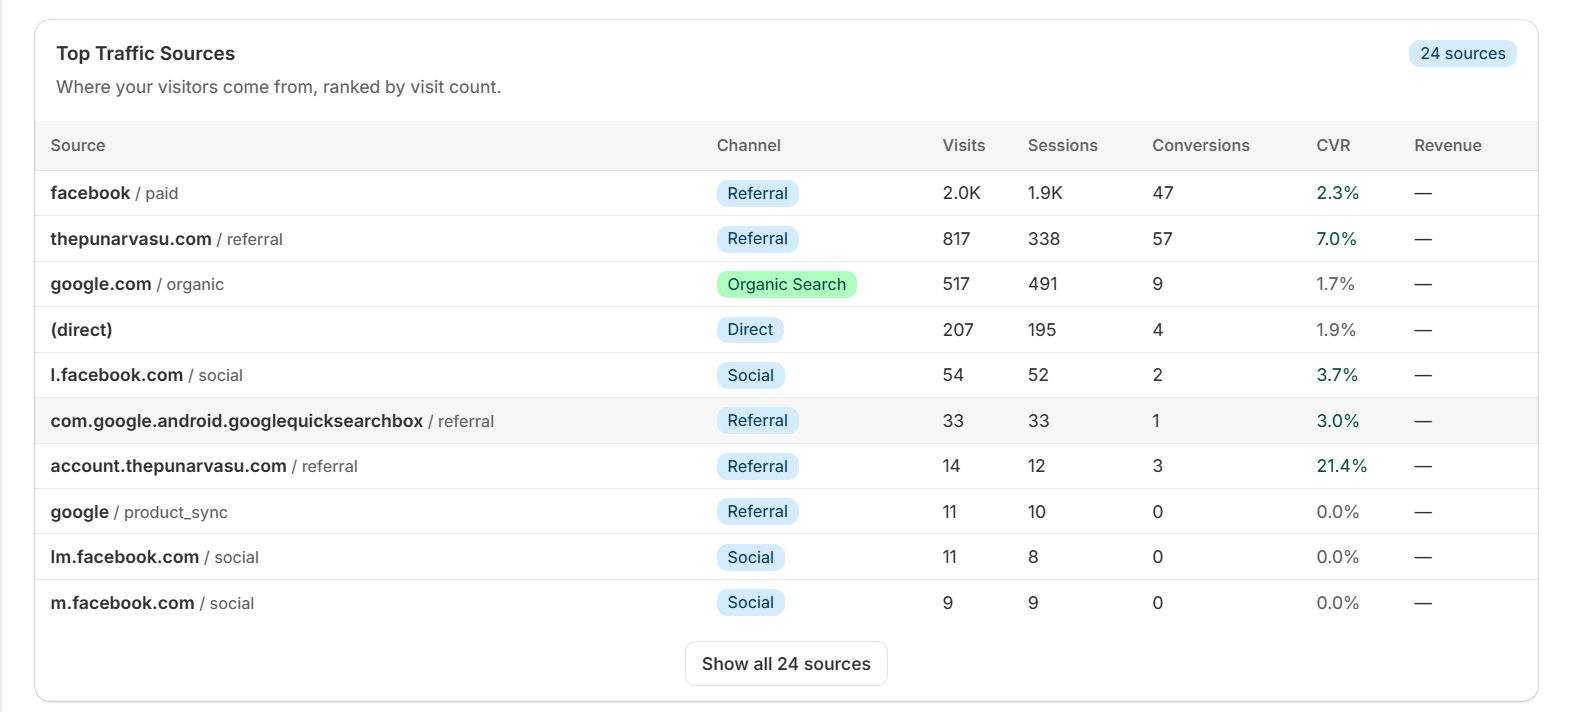
Top Traffic Sources
The sources table ranks up to fifty referrer domains by visit volume. Each row shows:
- Source — the domain name and medium (if available).
- Channel — a color-coded badge indicating which channel the source belongs to.
- Visits — total page views from this source.
- Sessions — unique visitor sessions.
- Conversions — sessions that resulted in an order.
- CVR — conversion rate, highlighted in green when above two percent.
- Revenue — total order value attributed to this source.
The table shows the top ten sources by default with a toggle to expand and view all.
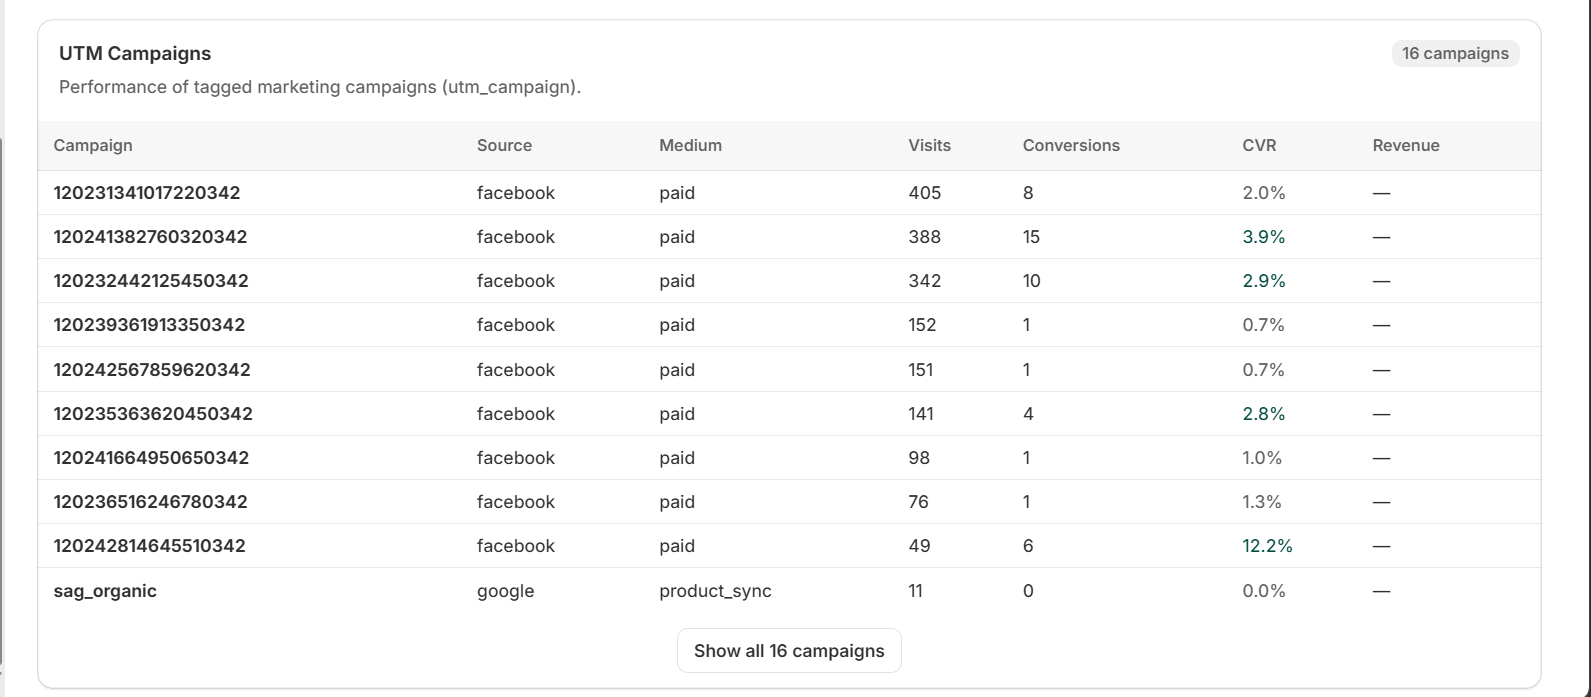
UTM Campaigns
When visitors arrive with UTM parameters in the URL, the campaigns table appears below the sources table. It groups traffic by the combination of campaign name, source, and medium, showing:
- Campaign — the utm_campaign value.
- Source — the utm_source value.
- Medium — the utm_medium value.
- Visits — page views from this campaign.
- Conversions — orders attributed to the campaign.
- CVR — campaign conversion rate.
- Revenue — total revenue from the campaign.
This table is where paid marketing performance becomes measurable — a merchant can see exactly which campaign tags are converting and at what return.
AI Search Readiness
Below the traffic tables sits the AI Search readiness card. It runs a deterministic scan of the store and surfaces anything that blocks AI shopping engines from recommending the merchant's products in answers to queries like "best wireless earbuds under $100" or "good moisturizer for sensitive skin."
The card shows three pieces of information at a glance: a headline count of outstanding issues ("4 AI-search issues found"), a severity breakdown ("2 critical, 2 high"), and the timestamp of the last scan. A pill in the top-left corner reads Action needed (red when critical findings exist, amber otherwise) or Scanning… (blue, animated) while a scan is in flight. When everything is clean, the card reads "AI Search readiness — No issues detected in the last scan."
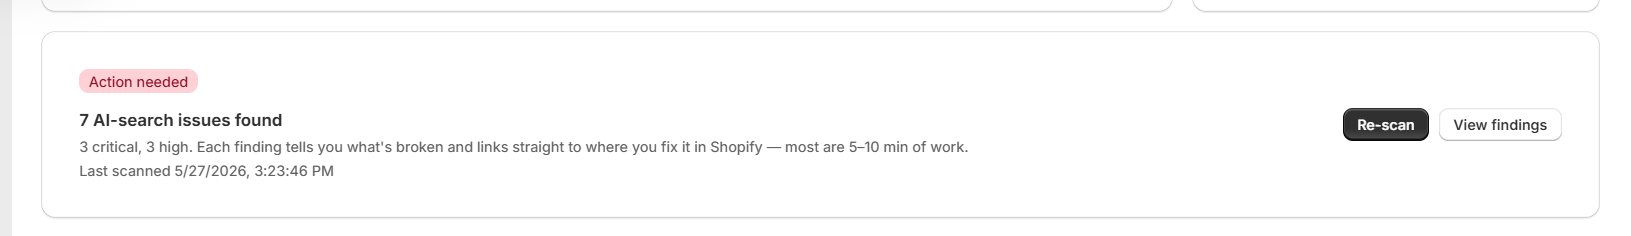
Two buttons sit on the right:
- Run scan (or Re-scan after the first run) triggers a fresh audit. The button switches to Scanning… with a spinner while the scan runs, and the pill swaps to a blue Scanning… badge. A scan typically takes ten to thirty seconds depending on storefront response times.
- View findings opens the dedicated AI Search panel where each issue gets its own card with full context and one-click actions.
If the audit can't reach the storefront — common during a pre-launch password-protected period, behind aggressive bot protection (Cloudflare Bot Fight Mode, Sucuri), or when AI-bot user-agents are blocked — a yellow banner explains the state: "Some checks couldn't complete on the last scan." This banner survives page reloads and cron-triggered scans, not just the in-flight Re-scan response.
What the scan checks
Three deterministic checks run on every audit:
- robots.txt bot blocks — parses the live
https://<store>/robots.txtand flags any of seven named AI bots (OAI-SearchBot, GPTBot, PerplexityBot, ClaudeBot, Claude-Web, GoogleOther, Applebot-Extended) that are explicitly disallowed from crawling. Honors RFC 9309 specificity — a bot-specificAllow: /correctly overrides a wildcardDisallow: /. - Variant identifiers — queries the Shopify Admin API for the fifty most recently updated products and flags variants missing both a barcode (GTIN) and an MPN metafield. AI shopping agents cluster competing offers on these global identifiers — without one, products are invisible in comparison answers.
- Product schema — fetches five sampled product pages (rotated across the catalog by day-of-year so the tail gets audited over time) and inspects each for Schema.org Product JSON-LD. Flags pages missing the Product block entirely, missing the
MerchantReturnPolicyinside the productOffer, or missingOfferShippingDetails.
When everything reads cleanly the merchant sees zero findings and a green confirmation. When the audit can't run cleanly (all storefront fetches blocked, Shopify Admin permissions broken, or the store has no products yet) the audit emits a low-severity advisory finding instead of a misleading "all clear" verdict.
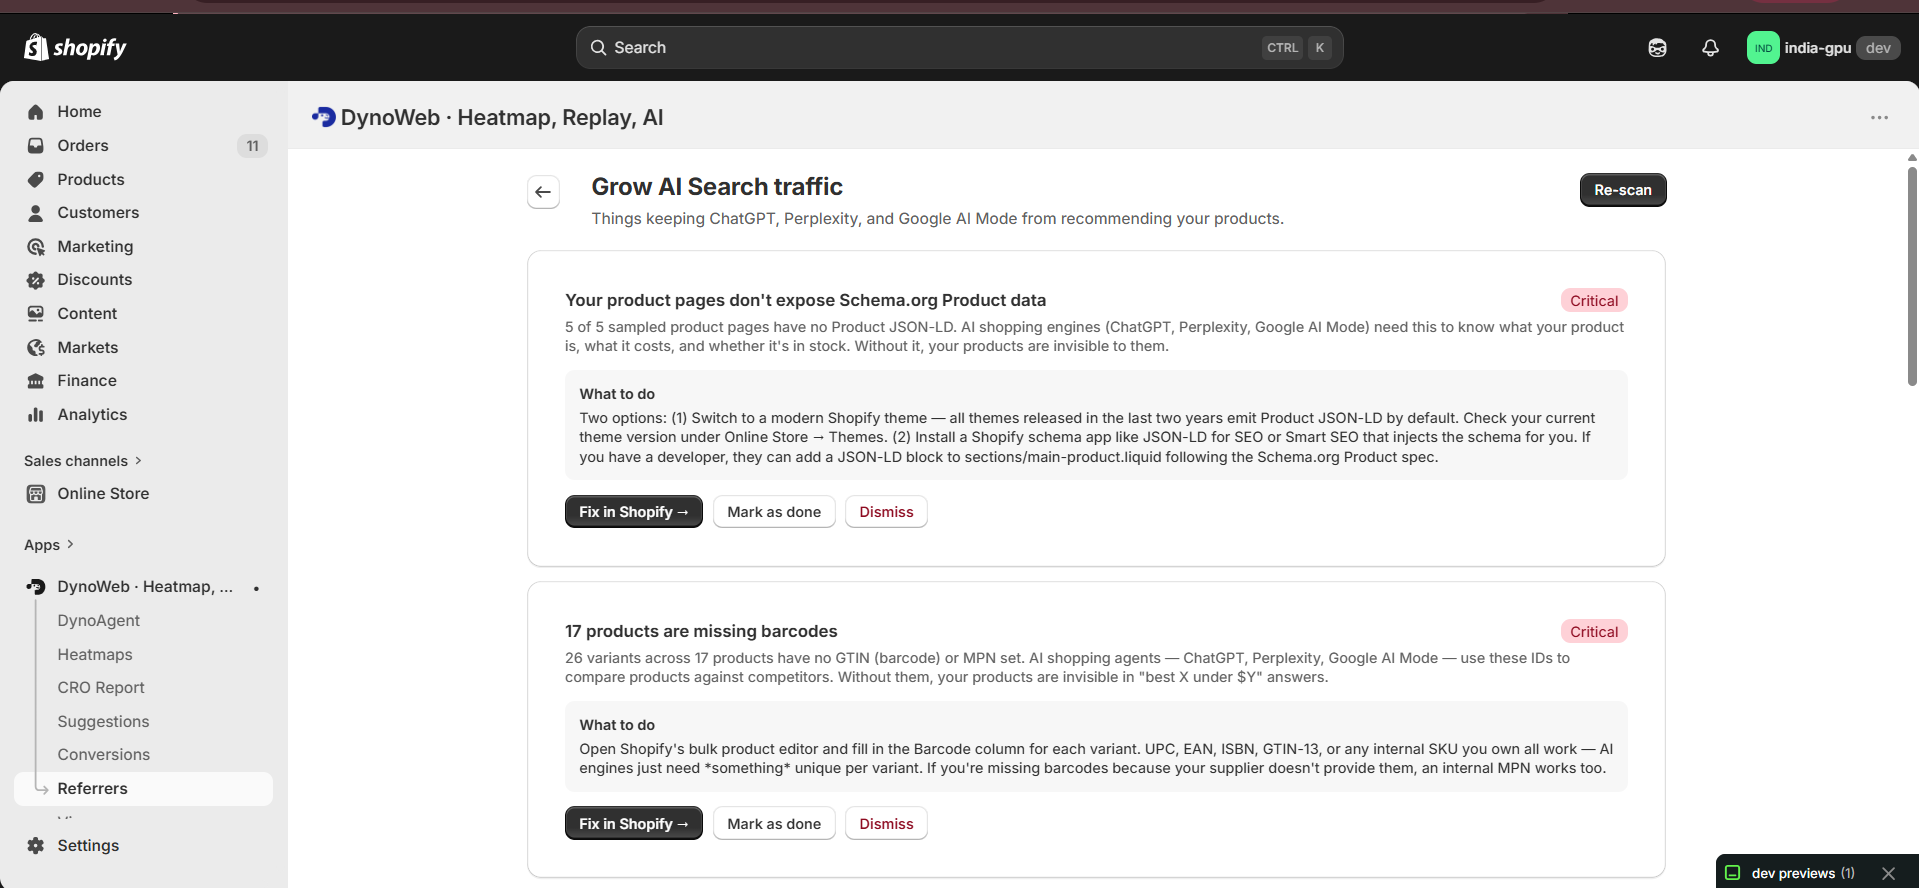
The findings panel
Clicking View findings opens /app/referrers/ai-search, a dedicated page that lists every outstanding finding as a card. Each card shows:
- Title and severity badge — critical (red), high (amber), medium (orange), or low (blue).
- Description — plain-English explanation of what's broken and why AI shopping engines care.
- What to do — a recommendation block with step-by-step merchant instructions.
- Fix in Shopify → — a deep-link button that opens the exact Shopify admin page where the fix happens (theme code editor for robots.txt, bulk product editor for barcodes, themes index for schema apps).
- Mark as done — flips the finding to APPLIED and moves it to the "Recently applied" section. If a future scan detects the issue has returned (e.g. a new product without a barcode was added), the finding automatically reopens.
- Dismiss — hides the finding permanently. Dismissed findings are not reopened by future scans.
A "Recently applied" section below the active findings lists everything the merchant has marked done, with the date and a Reopen button if they want to bring it back.
Filtering
Four filters at the top of the page control what data is shown:
- Date Range — last seven days, last thirty days, or last ninety days.
- Device Type — all devices, desktop, mobile, or tablet.
- Country — all countries or a specific country from the top thirty by visit count.
- Channel — all channels or a single channel to isolate its performance.
Filters update the URL parameters, so filtered views can be bookmarked or shared. The AI Search readiness card sits outside the date filter — it always reflects the most recent scan, since AI-discoverability isn't time-windowed.
How Traffic Is Classified
Every visit is classified automatically using a priority-based system:
- UTM parameters take priority. If
utm_sourceorutm_mediumis present, the medium value determines the channel — "cpc" and "ppc" map to paid search, "email" maps to email, "social" maps to social. - Known domains are matched next. Over twenty search engines, seventeen social networks, and eight email providers are recognized by domain.
- Everything else falls through. If the referrer is an unrecognized domain, the visit is classified as referral. If there is no referrer at all, it is classified as direct.
This means UTM-tagged links always get the correct channel attribution regardless of what domain they come from, while untagged organic traffic is still classified correctly by domain matching.
How To Use It Best
Start with the thirty-day view to get a stable picture of traffic mix. The channel breakdown donut chart immediately shows whether the store depends too heavily on a single source — a store where eighty percent of traffic is direct has a discovery problem, while one dominated by paid search has a margin problem.
Check the Source CVR card. If overall conversion rate is low, switch to the sources table and sort mentally by CVR. Sources with high visits but near-zero conversion are sending the wrong audience. Sources with high CVR but low volume are underinvested.
Use the device filter to compare mobile versus desktop traffic quality. A source that converts well on desktop but poorly on mobile may indicate a landing page that is not optimized for small screens.
For paid campaigns, the UTM campaigns table is the single source of truth. Compare campaign CVR and revenue against ad spend (tracked externally) to calculate return on ad spend. Campaigns with visits but no conversions should be paused or retargeted.
Run the AI Search readiness scan as soon as the store is set up — well before the first marketing campaign. AI shopping engines need crawl access, structured product data, and globally-unique identifiers to recommend products; fixing those at launch costs five to ten minutes per finding, while fixing them after a campaign has run means losing every recommendation that would have happened in between. After making changes (unblocking a bot in robots.txt, filling in missing barcodes, switching to a theme with full Product schema) click Re-scan to confirm the fix landed, then mark the finding as done.
After making changes to traffic sources — adjusting ad targeting, launching a new campaign, or posting on a new social channel — check back in seven days to see whether the new source appears in the table and how it compares. After making changes to AI-search readiness, the next monthly check is enough; AI shopping engines re-crawl on their own cadence, so improvements show up in recommendations gradually over the following weeks.
Referrers turns the traffic data DynoWeb collects into a clear acquisition map, showing merchants not just where visitors come from but which sources are worth investing in — and which technical blockers are quietly preventing the next wave of AI-driven traffic from arriving at all.