
Pillar guide — Shopify heatmap app
Understand Exactly How Customers Interact With Your Shopify Store
Do customers notice your Add-to-Cart button? Are they scrolling far enough to see your product benefits? Which sections are getting ignored completely? Most Shopify merchants know how many visitors their store receives — far fewer know what those visitors actually do once they arrive. Traditional analytics tools don't visualise behaviour; they offer numbers and charts. A Shopify heatmap app fills the gap by showing precisely where visitors click, how far they scroll, and what grabs their attention. DynoWeb's Shopify heatmaps help merchants identify hidden UX problems, optimise conversion paths, and enhance customer experiences — see exactly what's happening on each page instead of speculating about why visitors aren't converting.
- Click, scroll & attention
- Mobile + desktop
- Real-time
- AI-powered insights

The basics
What Is a Shopify Heatmap App?
The way customers engage with your store is shown graphically by a Shopify heatmap app. Heatmaps gather behavioural data from actual users and display which elements garner attention and which are disregarded.
They help merchants make more informed decisions about layout, content placement, and conversion optimisation — converting complex user behaviour into clear visual reports. Instead of depending only on pageviews and bounce rates, heatmaps offer context for visitor actions.
Why it matters
Why Shopify Merchants Need Heatmaps
Traditional analytics dashboards still conceal a lot of conversion problems.
- →Visitors may never notice your Add-to-Cart button.
- →Product details might be positioned too low on the page.
- →Important trust signals could be getting ignored.
- →Mobile users may struggle to interact with key elements.
Heatmaps instantly highlight these problems, enabling merchants to optimise pages based on real user behaviour rather than conjecture.
Three views, one picture
Types of Shopify Heatmaps
Each map answers a different question. Together they tell you where attention goes, what gets seen, and where shoppers get stuck.
Click heatmap
Shopify Click Heatmap
The precise locations where customers click on your store pages are displayed by a click heatmap. This helps retailers determine which navigation elements, buttons, links, and images get the most interaction — and identify distracting components that divert attention from crucial conversion actions.
- — Optimise CTA placement
- — Improve navigation structure
- — Identify dead clicks
- — Understand user intent
- — Increase engagement on important elements
Scroll heatmap
Shopify Scroll Heatmap
The distance a visitor travels down a page before departing is displayed on a scroll heatmap. Understanding scroll behaviour tells you whether users are reaching key content — product benefits, reviews, FAQs, shipping details, and purchase buttons.
- — Improve content positioning
- — Identify content fatigue
- — Increase visibility of key offers
- — Optimise page length
- — Improve mobile experiences
Attention heatmap
Shopify Attention Heatmap
An attention heatmap highlights areas that attract the highest levels of user engagement. These insights help merchants understand where visitors focus their attention — and which sections are being overlooked.
- — Improve page layouts
- — Optimise content hierarchy
- — Increase engagement
- — Highlight important products
- — Reduce distractions
What heatmaps surface
What Shopify Heatmaps Reveal
Heatmaps turn invisible behavior into evidence you can act on — across desktop and mobile.
Hidden Conversion Barriers
Underperforming Calls-to-Action
Content That Gets Ignored
Mobile User Behavior
Why it matters for CRO
How Heatmaps Improve Shopify Conversion Rates
Behavioural evidence beats opinion. Use real visitor data to inform every layout, copy, and design decision.
Better Product Pages
Improved User Experience
Smarter Design Decisions
More Effective Marketing Campaigns
Click maps
See exactly where shoppers tap — and mis-tap
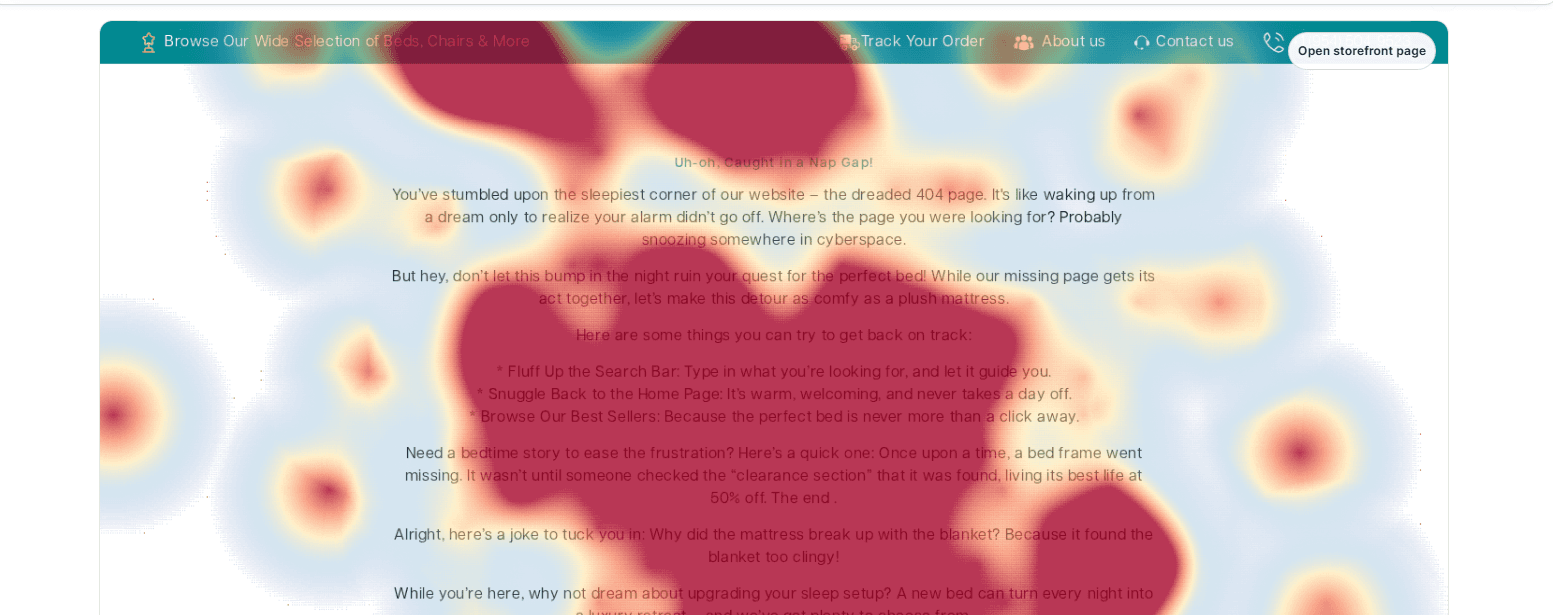
The click heatmap overlays every interaction onto your real page. Hot zones show what earns engagement; clusters on non-clickable elements reveal the false affordances quietly frustrating shoppers. It’s the fastest way to see whether your Add-to-Cart is actually getting the attention it needs.
- Every click and tap, aggregated onto the live page
- Spot non-interactive elements shoppers expect to work
- Confirm your key CTAs earn the engagement they should
Scroll maps
Find the line where shoppers stop reading
The scroll heatmap shows the exact depth where most visitors stop. The most common discovery: your strongest proof and even your Add-to-Cart sit below where the majority drop off — invisible to most shoppers. Now you know exactly what to move up.
- See the attention cliff on every template
- Engagement, above-fold, and friction rates at a glance
- Raise high-value content above where shoppers stop

Beyond heatmaps
Shopify UX Analytics Beyond Heatmaps
Heatmaps offer useful visual insights, but they work best when paired with deeper behavioural analytics. A detailed picture of consumer behaviour is produced by combining behavioural and visual analytics — DynoWeb helps merchants understand where visitors click, how far they scroll, what captures attention, where users abandon pages, and which paths lead to conversions.
- Where visitors click
- How far they scroll
- What captures attention
- Where users abandon pages
- Which paths lead to conversions

Built in
Key Features of DynoWeb Heatmaps
Everything you need to read behaviour clearly and act on it — without an analyst on staff.
Real-Time Behavioral Tracking
Click Heatmaps
Scroll Tracking
Mobile & Desktop Analysis
AI-Powered Insights
Side-by-side
Heatmaps vs Traditional Shopify Analytics
Numbers tell you what happened. Heatmaps tell you why.
| Traditional Analytics | Shopify Heatmaps |
|---|---|
| Shows traffic numbers | Shows user behavior |
| Measures pageviews | Visualises engagement |
| Tracks conversions | Explains conversion issues |
| Reports bounce rates | Reveals friction points |
| Provides metrics | Provides context |
Traditional analytics reveal what transpired. Heatmaps explain why.
From insight to action
How DynoWeb Helps Merchants Make Better Decisions
Stop guessing. Use behavioural evidence to prioritise the changes that actually move revenue.
Identify Conversion Opportunities
Reduce User Frustration
Increase Revenue
Optimise Every Page
Built for merchants
Why Shopify Merchants Choose DynoWeb
DynoWeb was created especially for Shopify merchants who don’t want overwhelming analytics dashboards but rather actionable insights. With heatmaps, behavior tracking, AI-powered suggestions, and conversion-focused reporting, merchants quickly determine what’s working, what isn’t, and what to optimise next.
Focus on the adjustments that have the biggest revenue impact instead of devoting hours to report analysis.
- →Click, scroll, and attention heatmaps in one place
- →AI-powered suggestions tied to the patterns the maps reveal
- →Mobile and desktop behaviour, side by side
- →Real-time data — no waiting for long reports
Common questions
Shopify heatmaps — frequently asked
What is a Shopify heatmap app?
A Shopify heatmap app visually tracks customer interactions like clicks, scrolling, and engagement patterns — helping merchants maximise UX and boost conversions.
How do click heatmaps help increase sales?
Click heatmaps highlight elements that draw attention and those that are ignored, helping merchants enhance CTAs and optimise page layouts.
What is a scroll heatmap?
A scroll heatmap displays the distance visitors travel down a page, so merchants can ascertain whether important content is being viewed.
Can heatmaps improve Shopify conversion rates?
Yes. Based on actual visitor behaviour, heatmaps help identify usability problems, optimise customer journeys, and enhance page performance.
Are Shopify heatmaps useful for mobile optimisation?
Absolutely. Merchants can enhance navigation, engagement, and mobile conversions by seeing how mobile users interact with your store.
Related
Explore the toolkit
Try DynoWeb
Turn Customer Behavior Into Better Conversions
Every click, scroll, and interaction tells you something about your customers' experience. DynoWeb's Shopify heatmap app helps retailers find untapped opportunities, remove obstacles, and optimise their store using actual consumer behaviour.