Feature — Shopify click heatmap tool
Visual Heatmaps for Every Page of Your Shopify Store
See exactly where customers click, tap, and stop scrolling on every page of your Shopify store. Click heatmaps, scroll maps, and attention maps in one place — lightweight and SEO-safe.
- 3 map types
- Mobile + desktop
- Sub-40 KB tracker
- Connected to AI fixes

Three maps
Click, scroll, and attention — per page, per device
Each map answers a different question about how shoppers experience your store. DynoWeb generates all three from the same lightweight tracker.
Click
Click & tap maps
Scroll
Scroll depth maps
Attention
Attention maps
Mobile
Mobile-specific maps
Per page
Every template covered
Lightweight
Sub-40 KB & SEO-safe
Click maps
See exactly where shoppers tap
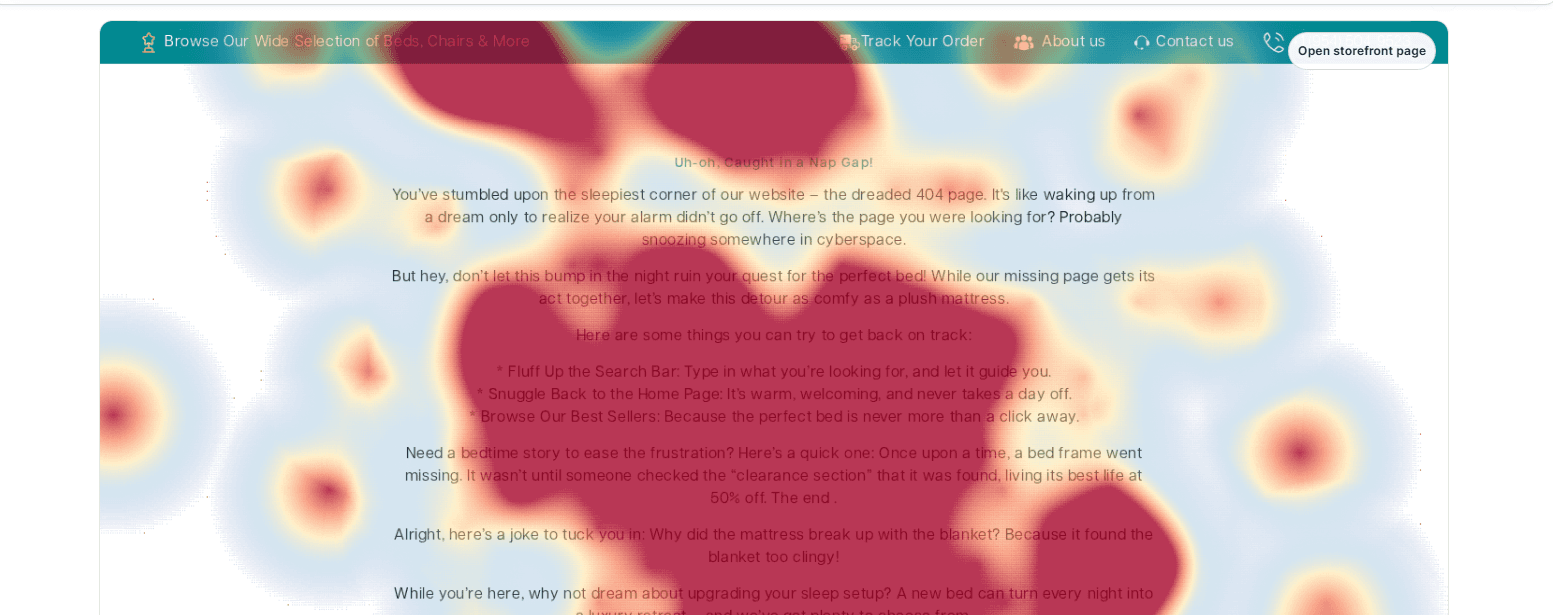
Every click and tap is aggregated into a single visual overlay. Bright clusters show your most-engaged elements; cold zones show what gets ignored. Most importantly, click maps expose the elements shoppers expect to be interactive but aren’t — a leading cause of silent frustration.
- Spot false affordances — images and labels shoppers tap that do nothing
- Confirm your add-to-cart and key CTAs actually get the clicks
- Find distractions pulling attention away from the buy button
Scroll maps
Find the exact line where shoppers stop reading
A color gradient shows how far down each page visitors actually scroll. The single most common finding: your add-to-cart button, reviews, or strongest proof sits below where most people stop — making it effectively invisible. Scroll maps tell you precisely where to move it.
- See the attention cliff on every key template
- Move high-value content above where the majority drop off
- Compare the shorter mobile fold against desktop

Filters & segments
Slice the data down to what matters
Filter heatmaps by device, traffic source, or page so you compare like with like. A mobile click map next to its desktop version usually reveals device-specific friction you’d never spot in aggregate.
- Device, source, and page-level filtering
- Isolate campaign traffic to fix the experience ad spend lands on
- Pair any map with the matching session replays in one click

Common questions
Heatmaps feature — frequently asked
What is a Shopify click heatmap tool?
A click heatmap tool aggregates where visitors click or tap on a page into a single color-coded overlay. Hot zones show high interaction; cold zones show neglected areas. On Shopify, this quickly reveals whether shoppers are engaging with your add-to-cart button, getting distracted by non-clickable elements, or missing key content entirely.
Can I see heatmaps for mobile and desktop separately?
Yes. DynoWeb generates device-specific heatmaps because shoppers behave very differently on a phone than on a desktop. Mobile maps surface fat-finger taps and thumb-zone mis-hits that only appear on touch devices.
How is this different from the heatmaps pillar page?
This page is about the feature — the click, scroll, and attention maps and how they work. The guide at /shopify-heatmaps explains how to read heatmaps and fold them into a complete conversion optimization workflow.
Are DynoWeb heatmaps lightweight and SEO-safe?
Yes. The tracker is under 40 KB and loads asynchronously, so generating heatmaps doesn't affect page speed, Core Web Vitals, or SEO.
Related
Keep exploring
Try DynoWeb
See where attention goes on every page
DynoWeb's heatmaps turn aggregated behavior into a clear visual picture — then hand you the fix for the friction they reveal.